
A. Introduction
Managing the project effectively is essential for its success. This involves documenting and updating the work and challenges involved and resolving any problems that may arise.
This simplified app or application that I will be creating using ReactPy [1] can be applied to tracking progress, issues and reports in the construction business such as in oil and gas projects.
I will use the ReactPy with fastapi [2] backend. Data will be saved in sqlite database using SQLModel [3]. I borrowed some ideas from making navigation bar using ReactPy [4], [12] which uses ReactPy router [5] to manage pages. I also used Plotly [11] to create charts based from a guide in adding plotly charts inside the ReactPy app [6] built with ReactPy. Elements are styled using bootstrap 5 [7].
The setup is to record all activities or unique pipe line numbers in the database. Each pipe line have spools that need to be fabricated first in the shop. Once completed they will be brought to the installation sites where the plant to produce oil and gas products will be built. These spools will be assembled, installed and tested according to plan and specifications to complete the piping installation phase.
B. User Interface Layout
We have a navigation bar at the top with buttons and dropdowns. The major menus are Task, Fabrication, Construction and Dashboard.
1. The Home page

2. The Blog page

3. The Input Task
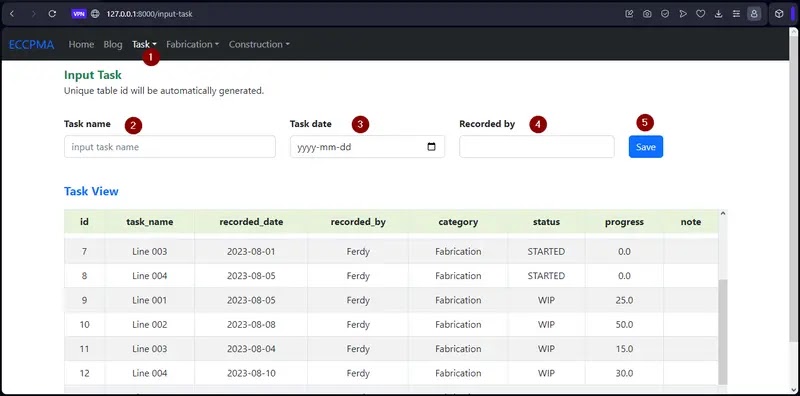
That is the form to register a pipe line number as a task. After clicking 'Save' the information is then saved to sqlite database using SQLModel [3]. The app will not save a line if it is already in the database.
The form is styled by bootstrap 5. Excluding the Task View, the component code is the following.
@component
def InputTaskForm():
    task_name, set_task_name = hooks.use_state('')
    task_date, set_task_date = hooks.use_state('')
    task_created_by, set_task_created_by = hooks.use_state('')

    def save_record(event):
        add_task(task_name, task_date, task_created_by)

    return html.form(
        {'on_submit': save_record},
        html.div(
            {'class': 'mb-3'},
            html.label(
                {'for': 'task', 'class': 'form-label fw-bold mt-3'},
                'Task name'
            ),
            html.input(
                {
                    'class': 'form-control', 'type': 'text', 'id': 'task',
                    'value': task_name, 'placeholder': 'input task name',
                    'maxlength': '50',
                    'on_change': lambda event: \
                      set_task_name(event['target']['value'])
                }
            ),
            html.label(
                {'for': 'date', 'class': 'form-label fw-bold mt-3'},
                'Task date'
            ),
            html.input(
                {
                    'class': 'form-control', 'type': 'date', 'id': 'date',
                    'value': task_date, 'placeholder': 'input task date',
                    'on_change': lambda event: \
                      set_task_date(event['target']['value'])
                }
            ),
            html.label(
                {'for': 'created_by', 'class': 'form-label fw-bold mt-3'},
                'Created by'
            ),
            html.input(
                {
                    'class': 'form-control', 'type': 'text',
                    'id': 'created_by', 'value': task_created_by,
                    'on_change': lambda event: \
                      set_task_created_by(event['target']['value'])
                }
            ),
            html.input(
                {'class': 'btn btn-primary my-3', 'type': 'submit',
                 'value': 'Save'}
            )
        )
    )
The add_task function is in sqlmodeldb.py module. See the app's code structure in the subsequent section.
def add_task(task_name:str, recorded_date: str, recorded_by: str):
    """Adds task to the table.

    Duplicate task name is automatically detected and is not saved.
    """
    if len(select_task_by_task_name(task_name)):
        return

    task = Task(
        task_name=task_name,
        recorded_date=recorded_date,
        recorded_by=recorded_by,
        category='Register',
        status='DONE',
        progress=100.0
    )

    with Session(engine) as session:
        session.add(task)
        session.commit()
That task view is another component, which simply retrieves the records from sqlite database.
@component
def TaskView():
    """Transfrom sqlite data into html."""
    df = sqlitedb_to_df(select_all_tasks())
    return html.div(DataframeToVdom(df))
The 'DataframeToVdom' component converts pandas dataframe to html and ReactPy [1] returns the VDOM. This table is styled by bootstrap 5 [7] with some custom class to fix the table header meaning scrolling the data does not scroll the table header.
@component
def DataframeToVdom(df):
    """Converts a pandas dataframe into ReactPy VDOM."""
    height = 400
    html_rec = df.to_html(
        index=False,
        border=0,
        justify='center',
        classes=['table', 'text-nowrap', 'table-bordered',
                 'text-center', 'table-striped', 'table-hover',
                 'table-primary']
    )
    return html.div(
        html.style(f"""
        .table-fix-head {{
            overflow-y: auto;
            height: {height}px;
        }}
        .table-fix-head table {{
            border-collapse: collapse;
            width: 100%;
        }}
        .table-fix-head th,
        .table-fix-head td {{
            padding: 8px 16px;
        }}
        .table-fix-head th {{
            position: sticky;
            top: 0;
            background: #97BDC4;
        }}
        """),
        html.div(
            {'class': 'table-fix-head'},
            utils.html_to_vdom(html_rec)
        )
    )
4. The Search Task

The search task is used to get the information of a given task name. Here we can see when and who created it. Basically we can see the activity timeline on this pipe line or task. This is very useful in tracking and solving issues in the project.
This is our search task form code.
@component
def SearchTaskForm():
    search_task_name, set_search_task_name = hooks.use_state('')
    search_df, set_search_df = hooks.use_state(pd.DataFrame())

    @event(prevent_default=True)
    def search_record(event):
        df = pd.DataFrame()
        if search_task_name != '':
            df = find_task(search_task_name)
            set_search_df(df)

    return html.form(
        {'on_submit': search_record},
        html.div(
            {'class': 'mb-3'},
            html.label(
                {'for': 'taskname', 'class': 'form-label fw-bold mt-3'},
                'Task name'
            ),
            html.input(
                {
                    'class': 'form-control',
                    'type': 'text',
                    'id': 'taskname',
                    'value': search_task_name,
                    'placeholder': 'input task name',
                    'on_change': lambda event: \
                        set_search_task_name(event['target']['value']),
                }
            ),
            html.input(
                {'class': 'btn btn-primary my-3', 'type': 'submit',
                 'value': 'Search task'}
            ),

            html.div({'class': 'fs-5 fw-bold mt-3 text-primary'},
                     'Search Result'),
            DataframeToVdom(search_df)
        )
    )
5. Fabrication Status Input

When there is progress and issues of the spool being fabricated, add that information on this form. This record can help resolve issues and can provide insights of how to manage manpower optimally.
Spools are smaller sections that long pipe lines are split into. This lowers the installation cost on site, keeps the fabrication quality high at the shop, and avoids welding on site, which can be unsafe for the construction and affect many departments like piping, mechanical, civil, electrical, instrumentation and more. Before the spools are sent to the site, components that need to be welded have to be welded such as weld flanges, tees, elbows, etc.
6. Construction Status Input
The input form is similar to Fabrication. Progress and issues, etc. related to construction will be updated.7. Dashboard
The dashboard page contains project's progress and issues summaries.

We have the overall progress bar chart for both fabrication and construction categories. It shows us quickly how far we have done so far.
The weekly cumulative progress charts can tell us how fast we are doing weekly. Components, functions, etc. that are related to dashboard are in dashboard.py module.
The dashboard component code would look like this.
@component
def DashboardContent():
    return html.div(
        Summary()
    )


@component
def Dashboard():
    return html.div(
        html.div(
            {'class': 'container'},
            NavBar({'Dashboard': True}),
            html.div(
                html.div(
                   {'class': 'fw-bold fs-5 mt-5 py-3 text-center'},
                   LABEL
                ),
                DashboardContent()
            )
        )
    )
Currently the Summary component shows five components: the LineStatus, LineHoldStatus and the three charts.
@component
def Summary():
    df = sqlitedb_to_df(select_all_tasks())
    if len(df) < 1:
        return
    gb = df.groupby('task_name')
    current_line_status = gb.last().reset_index()
    num_lines = len(current_line_status)

    # Plot fabrication and construction progress.
    fab_done_pct = fabrication_progress(df, num_lines)
    con_done_pct = construction_progress(df, num_lines)
    progress_dict = {
        'category': ['Fabrication', 'Construction'],
        'progress_%': [fab_done_pct, con_done_pct]
    }
    df_fab_con_progress = pd.DataFrame(progress_dict)

    # Task with hold current status.
    df_hold = current_line_status.loc[current_line_status['status'] == 'HOLD']

    return html.div(
        html.div(
            {'class': 'container'},
            html.div(
                {'class': 'row'},
                html.div(
                    {'class': 'col'},
                    html.h5(
                        {'class': 'mt-1'},
                        'Overall Progress'
                    ),
                    BarChart(df_fab_con_progress, 400)
                ),
                html.div(
                    {'class': 'col'},
                    html.h5(
                        {'class': 'mt-1'},
                        'Fabrication Weekly Cumulative Progress'
                    ),
                    LineChart(df, 'Fabrication', 400)
                ),
                html.div(
                    {'class': 'col'},
                    html.h5(
                        {'class': 'mt-1'},
                        'Construction Weekly Cumulative Progress'
                    ),
                    LineChart(df, 'Construction', 400)
                )
            ),
            html.div(
                {'class': 'row'},
                html.h5({'class': 'mt-3'}, 'Line current status'),
                LineStatus(current_line_status)
            ),
            html.div(
                html.h5({'class': 'mt-3'}, 'Lines with HOLD status'),
                LineHoldStatus(df_hold)
            )
        )
    )
I read the data from sqlite database, convert it to a pandas dataframe and from there calculate the information needed to show in this dashboard.
The Dashboard component is added in the root.
@component
def Root():
    return simple.router(
        route('/', Home()),
        route('/blog', Blog()),
        route('/search-task', SearchTask()),
        route('/input-task', InputTask()),
        route('/fabrication-status', AddFabricationStatus()),
        route('/construction-status', AddConstructionStatus()),
        route('/dashboard', Dashboard()),
        route('*', MissingLink())
    )
C. Code Structure

I am using visual studio code [8] as IDE. The project structure is simple, there is 'data' folder to store our sqlite database, there is 'modules' folder as a container to different modules such a home, blog, task, fabrication, etc. and the main.py or main module is at the root of the current working folder 'project management app'.
1. The module files

Each page has a module such as home.py, blog.py, and others. Components, utility functions, constants, etc. are present within each module. Unrelated component is imported from another module.
For example our blog.py module contains the main Blog component.
@component
def Blog():
    return html.div(
        html.div(
            {'class': 'container mt-3'},
            NavBar({'Blog': True}),
            BlogContent()
        ),
    )
That NavBar component is imported from the navbar.py module.
from modules.navbar import NavBar
That Blog component contributes to the building of the app found in the main module.
main.py... @component def Root(): return simple.router( route('/', Home()), route('/blog', Blog()), route('/search-task', SearchTask()), route('/input-task', InputTask()), route('/fabrication-status', AddFabricationStatus()), route('/construction-status', AddConstructionStatus()), route('/dashboard', Dashboard()), route('*', MissingLink()) ) app = FastAPI() configure( app, Root, options=Options( head=html.head( html.link(BOOTSTRAP_CSS), html.script(BOOTSTRAP_SCRIPT), html.script(PLOTLY_JS), html.title(PAGE_HEADER_TITLE) ) ) )
2. The required libraries to run the app
requirements.txtreactpy[fastapi]
uvicorn[standard]
pandas
sqlmodel
reactpy-router
plotly
Pandas library [9] is used to get query results from table, useful in generating summaries.
The sqlmodel is for handling sqlite database.
Plotly is used to generate charts.
D. Source code
The full source code of this app is in my github project management app [10] repository.
E. References
[1]. ReactPy for building user interfaces in Python
[2]. FastAPI - a modern, fast (high-performance), web framework for building APIs with Python 3.7+ based on standard Python type hints.
[3]. SQLModel - a library for interacting with SQL databases from Python code
[4]. How to make a navigation bar in reactpy
[5]. ReactPy router - a URL router for ReactPy
[6]. How to add a plotly charts in reactpy
[7]. Bootstrap 5 - an HTML, CSS, and JavaScript framework for building responsive web sites
[8]. Visual Studio Code - a source-code editor made by Microsoft with the Electron Framework, for Windows, Linux and macOS.
[9]. Pandas - a library for data analysis and manipulation
[10]. Github Project management app repository
[11]. Plotyly - a graphing library that makes interactive, publication-quality graphs
[12]. Github reactpy navigation bar repository